This note is a constant work in progress, and things are being continuously added
This note will be useful to you if you are:
- A senior revising/updating their knowledge
- A junior data engineers building up a vocabulary of solutions to common problems
How to approach performance optimization?
Your operational loop is going to be:
- Determine the Service Level Agreement (SLA) (in this case - time budget within which the pipeline has to execute)
- Build pipeline
- Measure metrics
- Detect performance bottleneck
- Diagnose performance bottleneck
- Reduce time lost in bottleneck
- Loop steps 4 to 6 until SLA is met with a good margin
- End
Diagnosis
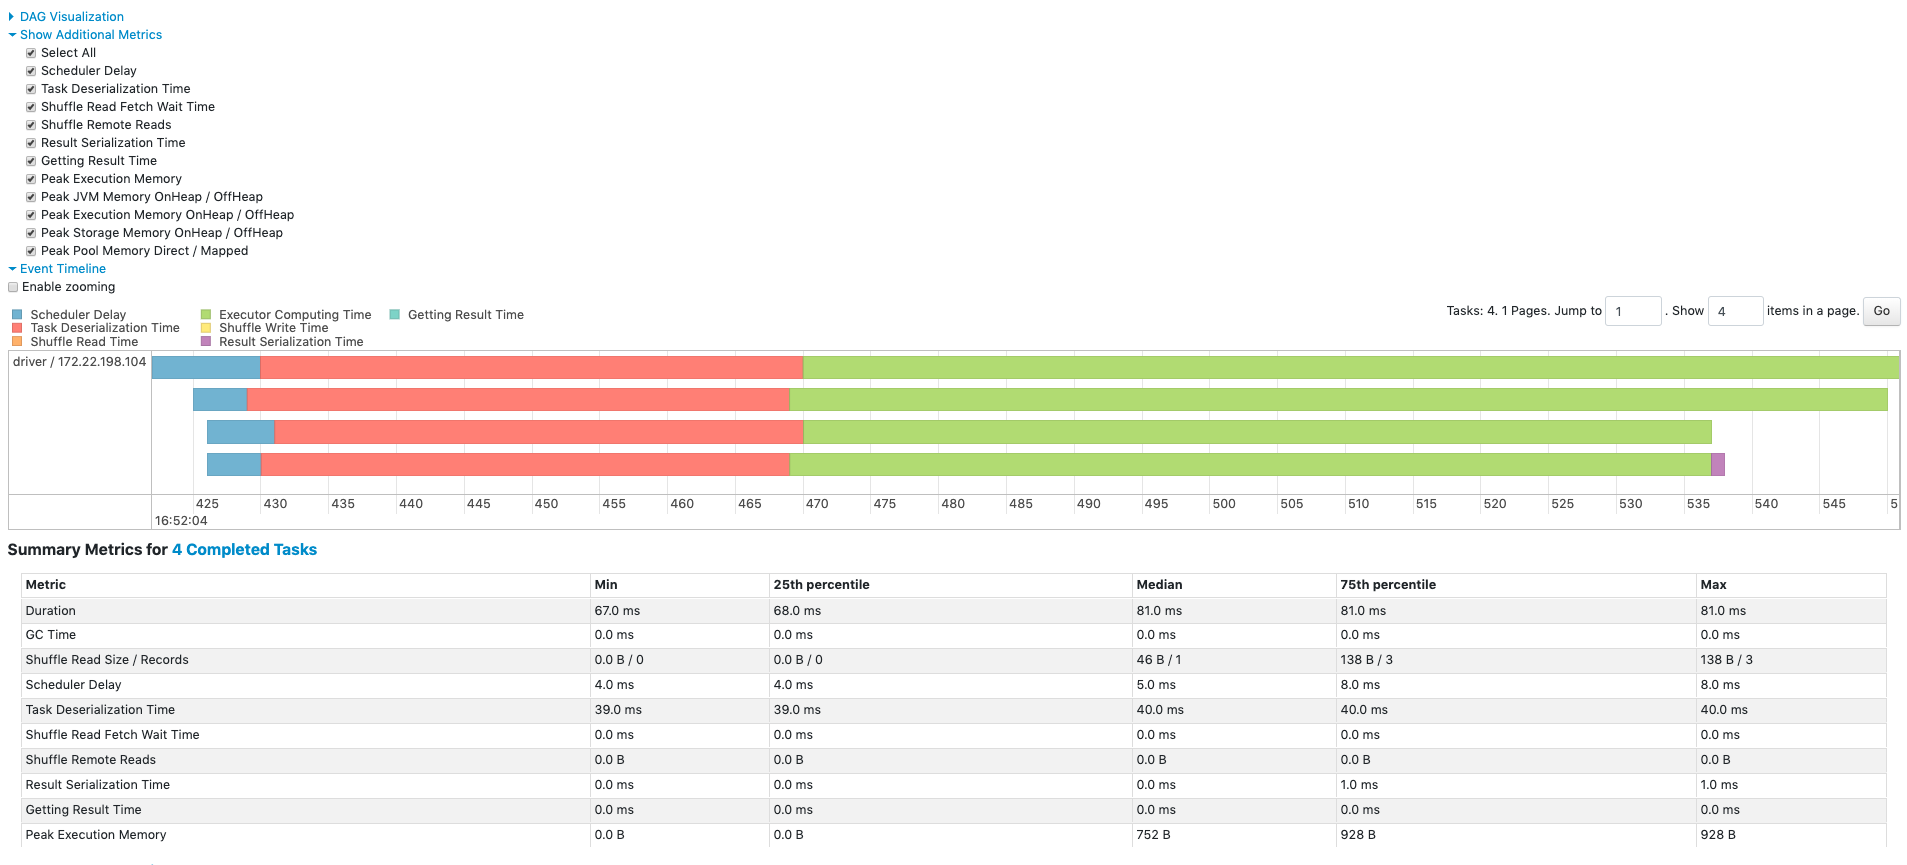
Diagnosis is primarily done via the Spark Web UI.
An ideal pipeline will have minimal disk spills, and very uniform task execution times.
Data Skews
Find a slow stage, and dig into its execution details via the Spark UI.
As a habit, first look into the summary metrics of a stage. Particularly check for min, median and max. Max should not be very large compared to median. (My personal rule of thumb is - when max is 3 times median, I treat it as a warning. When max is 5 times median or more, I treat it as skew).
- Data skews will show up as tasks within a stage that take much longer to complete than others.
- Large shuffle read size for current stage's task - indicates that a partition has got too much data
- Large shuffle write size for current stage - indicates that one of the partitions is large, and is going to cause skew in the next stage also
- Large Disk Spill Write for one or few tasks - indicates that the particular task required more memory than available, and had to spill to disk to continue processing. This means that there was too much data for that particular partition. A clear indicator of data skew.
General slowness due to shuffles
For a stage, just looking at 4 variables will be enough
- Shuffle Read Size
- Shuffle Write Size
- Shuffle Spill
- Task Duration
Memory usage anomalies
When the memory required exceeds the physically available memory, spills to disk will occur. Spilling to disk is a defence mechanism against OOM. If it fails, the Spark UI will show tasks that failed due to OOM.
Note: Only execution memory can spill to disk. Storage memory will simply get evicted. User memory (UDF, py objects, JVM overheads) cannot spill to disk.
Look out for abnormally large "Disk Spill Write" values for all tasks of a stage. This means that partition sizes are too large across the dataset. This isn't data skew. To resolve this, break the data into more partitions (re-partitioning will help).
There can be A LOT of causes for OOM. Here are some selected scenarios:
- Broadcasted table in join is too large - the table has to be fully loaded into memory before it can be broadcasted. While loading this, if the executor cannot make enough memory for it (even after evicting dataframes from storage memory), there will be OOM
- UDF ends up consuming too much memory, leading to OOM (I haven't seen this one practically. But it is possible.)
Speed up reads
Faster SQL DBMS ingestion
By default, spark will read all SQL query data through a single query (as a single partition). This will be very slow (as there is no parallelization), and also cause a gigantic skew (as it will form only one partition).
To avoid this issue, there are mechanisms to tell the JDBC reader how to parallelize the query.
Parallelize on a numeric column
If the primary key column is if type int, long, timestamp, then it is quite straightforward:
df = spark.read.jdbc(
    url=jdbc_url,
    table="transactions",
    column="id",             # numeric column used for partitioning
    lowerBound=1,
    upperBound=100,
    numPartitions=10,
    properties=props
)
This will end up firing 10 SQL queries in parallel:
SELECT * FROM transactions WHERE id >= 1 AND id < 11;
SELECT * FROM transactions WHERE id >= 11 AND id < 21;
...
...
SELECT * FROM transactions WHERE id >= 91 AND id <= 100;
Parallelize on a string column
The predicates will have to be supplied manually
predicates = [
    "region = 'NORTH'",
    "region = 'SOUTH'",
    "region = 'EAST'",
    "region = 'WEST'"
]

df = spark.read.jdbc(
    url=jdbc_url,
    table="customers",
    predicates=predicates,
    properties=props
)
Each string in predicates will be used in a WHERE clause as follows:
SELECT * FROM customers WHERE region = 'NORTH';
SELECT * FROM customers WHERE region = 'SOUTH';
SELECT * FROM customers WHERE region = 'EAST';
SELECT * FROM customers WHERE region = 'WEST';
Parallelize using a hashing function
This method will put load on the db, but the data will be evenly distributed among the spark job's executors.
This is the only realistic method for dealing with columns containing high cardinality non-numeric datatypes like UUID strings etc.
Eg - Split the workload across 4 queries:
num_partitions = 4
predicates = [f"MOD(ABS(HASH(user_id)), {num_partitions}) = {i}" for i in range(num_partitions)]

df = spark.read.jdbc(
    url=jdbc_url,
    table="(SELECT * FROM users) AS users_subquery",
    predicates=predicates,
    properties=props
)
This will create the following queries:
SELECT * FROM users WHERE MOD(ABS(HASH(user_id)), 4) = 0;
SELECT * FROM users WHERE MOD(ABS(HASH(user_id)), 4) = 1;
SELECT * FROM users WHERE MOD(ABS(HASH(user_id)), 4) = 2;
SELECT * FROM users WHERE MOD(ABS(HASH(user_id)), 4) = 3;
Parallelize on timestamps
This is great for reconciliation runs etc
predicates = [
    "created_at < '2024-01-01'",
    "created_at >= '2024-01-01' AND created_at < '2024-04-01'",
    "created_at >= '2024-04-01'"
]
df = spark.read.jdbc(
    url=jdbc_url,
    table="(SELECT * FROM users) AS users_subquery",
    predicates=predicates,
    properties=props
)
Slow transformations
Slow joins
(There are more details in the spark join strategies note)
1 small table and 1 large table
When one of the tables is small enough to fit into memory, perform a broadcast hash join (usually by broadcasting a dimension table)
# Force spark to send small_df to all executors
broadcast_join = big_df.join(broadcast(small_df), big_df.big_id == small_df.small_id, "inner")
2 medium sized datasets
When the dataset is too large to be broadcasted, but small enough for its hash can fit into memory, use the shuffle hash join.
(Spark creates a hash table of the columns in the join condition, and then uses these hash tables for comparison. So the hash table must fit into memory.)
hash_join = big_df.hint("shuffle_hash").join(
    small_df.hint("shuffle_hash"),
    big_df.big_id == small_df.small_id,
    "inner"
)
Chained withColumn() causing slowness
Chaining withColumn will slow down spark code.
REASON:
Spark has lazy evaluation. So, every withColumn will trigger a new transformation. For each withColumn(), a new intermediate DataFrame will be created. These intermediate dataframes will stay in memory until execution reaches an action (after which the dataframes will be eligible for garbage collection).
And, if you really care about it, there is also the processing delay on the query optimizer side. Every withColumn creates a new logical plan root node. In other words, every withColumn() creates a new projection node in the job's execution DAG. So, for every projection, spark will re-resolve every column reference, re-run type checking(if applicable), re-run predicate & projection pushdowns etc. (So, this leads to a quadratic time complexity on cost analyzer and optimizer's side).
SOLUTION?
Use a single select statement. The single select statement won't create intermediate dataframes - massively reducing memory as well as execution time.
# BEFORE OPTIMIZATION #########

df_new_cols = (
    df
    .withcolumn("new_col_a", col("existing_col_a") * 2)
    .withcolumn("new_col_b", col("existing_col_b") * 2)
    .withcolumn("new_col_c", col("existing_col_c") * 2)
)

# AFTER OPTMIZATION ##########
df_new_cols = df.select(
    col("col1"),
    col("col2"),
    col("col3"),
    (col("existing_col_a") * 2).alias("new_col_a"),
    (col("existing_col_b") * 2).alias("new_col_b"),
    (col("existing_col_c") * 2).alias("new_col_c"),
)
Random issues
Parquet specific issues
Parquet vectorized reader fails for decimal columns (until spark 3.1)
Databricks spark has vectorized reads enabled by default spark.sql.parquet.enableVectorizedReader = True. This leads to a huge boost in parquet parsing performance, but it also causes problems when reading decimal columns. This is because vectorized reader doesn't support decimal, and starts treating decimal values as binary.
Turn it off if this issue is encountered:
park.conf.set("spark.sql.parquet.enableVectorizedReader", "false")
Blog posts
- My subconscious doesn't like LLMs 2025 Jul 16 | 10m (1970 words)
- Computers understanding humans makes codebases irrelevant 2023 Apr 08 | 6m (1269 words)
- Own your email's domain 2023 Feb 12 | 5m (934 words)
- Isolates + storage over http + orchestrators is the future that has arrived 2023 Jan 03 | 6m (1120 words)
Articles
I learn through writing, so I write a lot. Most of these are ever evolving pieces.
python
- Unicode string normalization schemes in Python 2024 May 06 | 7m (1329 words)
resources
- Links collection 2025 Jun 15 | 3m (647 words)
- Papers, books, talks etc 2025 Jun 02 | 4m (865 words)
spark
- Spark Engineering 2025 Oct 16 | 29m (5351 words)
- Spark performance optimization compendium 2025 Oct 11 | 7m (1370 words)
webtech
- JWT - a quick overview of its working and encryption algorithms 2024 Apr 02 | 12m (2321 words)
work
- Lecture - You and your research by Dr. Richard Hamming 2024 Oct 14 | 1hr18m (14441 words)
- Why charge more as an engineer 2025 Oct 13 | 6m (1252 words)